Tutorial: Automate Data Validation and Model Monitoring Pipelines with DVC and Evidently
Imagine you're in charge of weekly batch scoring jobs in a retail setting, where accurately predicting customer behavior is crucial. The challenge? Ensuring your machine learning models remain precise and efficient as time progresses, and verifying that your data consistently reflects the real-world scenario. This tutorial will equip you with the skills to use DVC and Evidently, transforming them into powerful allies for automating data validation and model monitoring pipelines. Tailored for Data Scientists, ML Engineers, MLOps professionals, and Team Leads, this guide offers a streamlined approach to boost and sustain your model's performance in the ever-evolving business landscape.
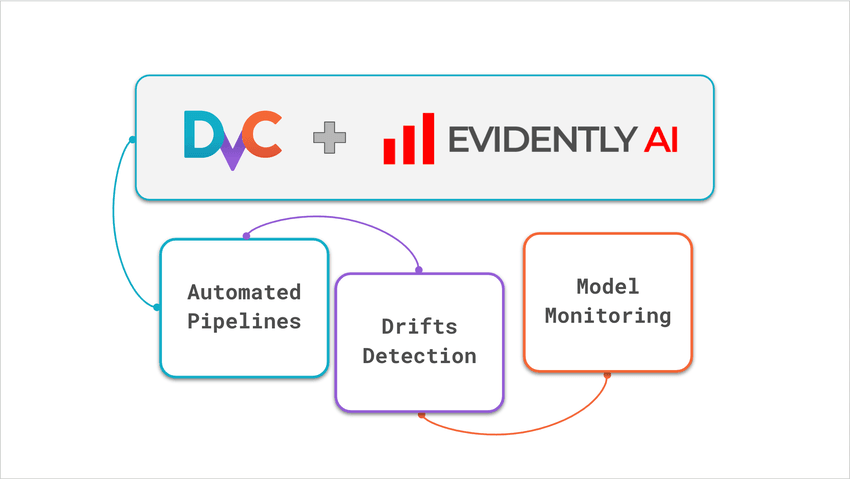
Evidently + DVC integration example
Feel free to clone the repository provided. It's more than a learning tool; it's a flexible reference architecture that you can adapt to fit your unique use cases.
Why DVC and Evidently?
In the realm of Machine Learning Operations (MLOps), ensuring the robustness and reliability of models is paramount. Using the right tools can significantly enhance your MLOps practices.
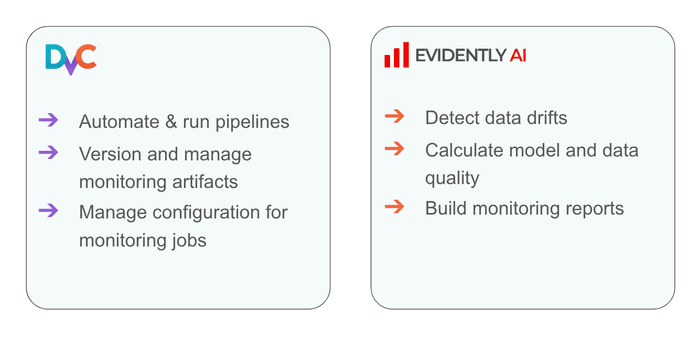
DVC is an open-source tool that brings agility and reproducibility to data science projects by treating data and model training pipelines as software. It connects versioned data sources and code with pipelines, track experiments, register models — all based on GitOps principles.
Evidently is an open-source Python library to evaluate, test, and monitor ML models. It has 100+ built-in metrics and tests on data quality, data drift, and model performance and helps interactively visualize them.
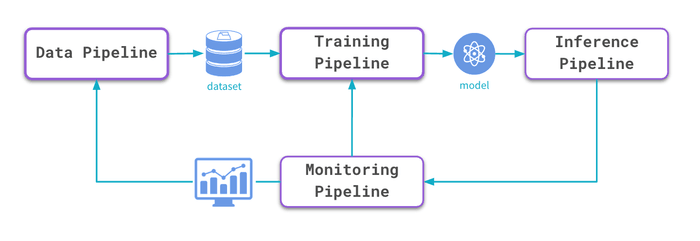
When used together, DVC and Evidently tools offer a comprehensive solution for training, predicting, and monitoring ML models.
💡 Want to learn more about DVC and Evidently?
- Iterative Tools for Data Scientists & Analysts course with DVC
- Open-source ML observability course with Evidently
Tutorial scope
This tutorial teaches you how to build DVC pipelines for training and monitoring jobs, parse Evidently reports, and version reference datasets.
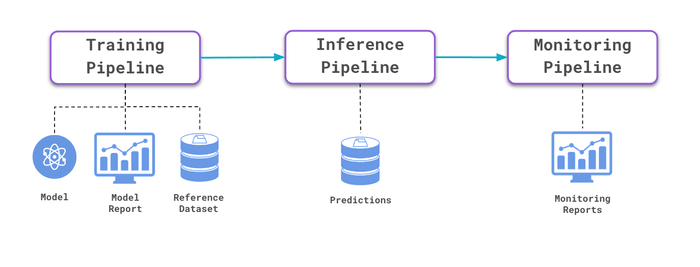
By the end of this tutorial, you will learn how to implement an ML monitoring architecture using:
- Evidently to perform data quality, data drift, and model quality checks.
- DVC to run monitoring jobs and version monitoring artifacts
- DVCLive to save monitoring metrics from Python scripts and visualize in VS Code.
Using a Python virtual environment, you can run the example on a local machine.
Dataset: Sales Forecasting
Dataset. You will be diving into a Kaggle dataset focused on Bike Sharing Demand. The goal is to predict hourly bike rental volumes.
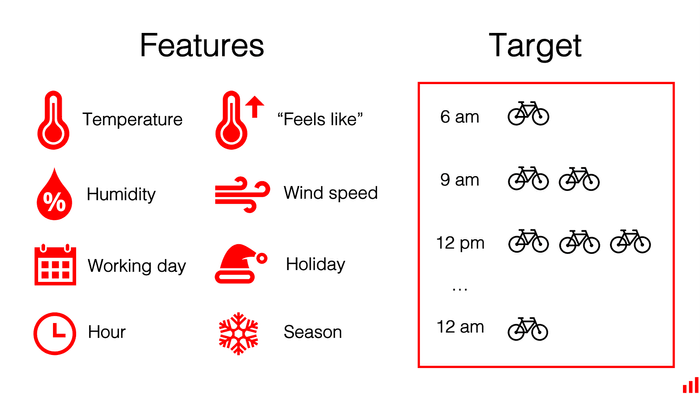
ML Application. Use historical usage and weather data to predict bike rental demand. Essential for operational efficiency and customer service.
Similar applications:
- Applicable in sectors like retail, transportation, and energy for demand prediction.
- Ensures models stay relevant and effective despite changing data patterns.
Prerequisites
We expect that you:
- Have learned the for DVC by following the Get Started with DVC guide
- Went through the Evidently Get Started Tutorial and can generate visual and JSON Reports with Metrics.
To follow this tutorial, you'll need the following tools installed on your local machine:
- Python version 3.11 or above
- Git
- VS Code and DVC Extension for VS Code
💡 Note: we tested this example on macOS/Linux.
👩💻 Installation
First, install the pre-built example. Check the origin README file for more technical details and notes.
1. Fork / Clone this repository
Clone the GitHub repository with the example code. This repository provides the necessary files and scripts for setting up the integration between Evidently and DVC.
$ git clone https://github.com/iterative/evidently-dvc.git
$ cd evidently-dvc
2. Install Python dependencies
$ python3 -m venv .venv
$ echo "export PYTHONPATH=$PWD" >> .venv/bin/activate
$ source .venv/bin/activate
$ pip install -r requirements.txt
💡 Note: To ensure everything runs smoothly, please make sure to execute all the code examples provided below within an activated virtual environment.
🚀 Run ML monitoring example
Now, let’s launch the pre-built example to run monitoring pipelines and manage monitoring artifacts using DVC and Evidently.
1. Running the train pipeline
To run the entire pipeline, execute a simple command in your terminal. Make sure you're in the project's root directory:
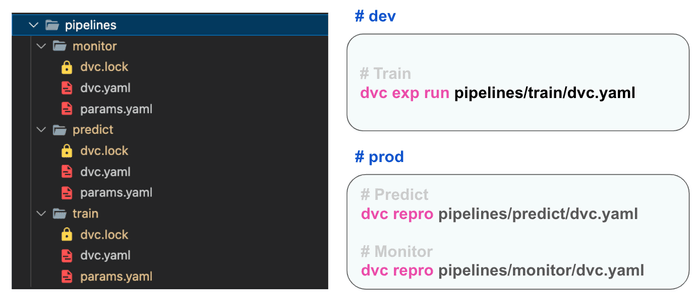
$ dvc exp run pipelines/train/dvc.yamlThis command runs the stages defined in the dvc.yaml file located in
pipelines/train. DVC experiments allow you to track changes made during each
run, making it easier to iterate and improve your model. Here’s what happens in
each stage:
- load_data:
- Downloads and unzips the dataset into your
data/directory.
- Downloads and unzips the dataset into your
- extract_data:
- Executes
src/stages/extract_data.py, using parameters frompipelines/train/params.yaml. - Outputs training and testing datasets to specified paths.
- Executes
- train:
- Runs
train.py, training the model with the training data. - Saves the model to
models/model.joblib
- Runs
- evaluate:
- Runs
evaluate.pyto assess the model on the test data. - Outputs reference data for monitoring to
data/reference_data.csv. - Builds the model performance report using Evidently Regression Preset and
saves it to
reports/train/model_performance.html. - Saves metrics to
reports/train/metrics.json.
- Runs
After the pipeline is complete, you can
- (1) visualize training metrics DVC Extension for Visual Studio Code ,
- (2) open the detailed model performance HTML report built with Evidently in the browser.
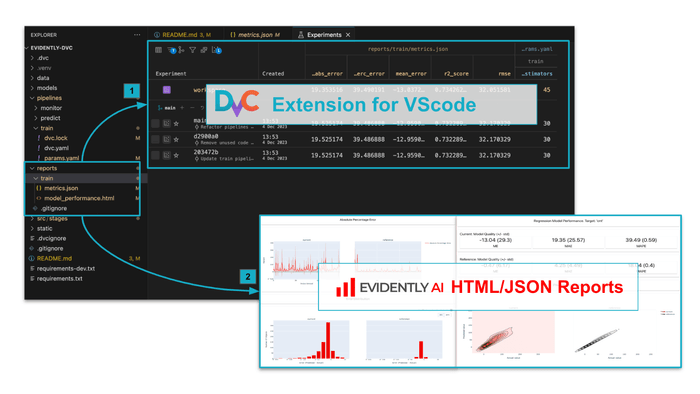
💡 Note: Make sure you have the DVC Extension for Visual Studio Code installed.
2. Running the predict pipeline
Once your model is trained and evaluated, the next vital step is to perform predictions on new data. To run the pipeline, execute the following command in your terminal:
$ dvc repro pipelines/predict/dvc.yamlHere’s what happens in each stage:
- predict:
- Executes
src/stages/predict.py, using parameters frompipelines/predict/params.yaml. - Saves predictions to a CSV file, formatted as
data/predictions/${predict.week_start}--${predict.week_end}.csv. Parametersweek_startandweek_endare located in the correspondingparams.yamlfile.
- Executes
DVC automatically starts versioning control for the saved CSV file. You can now push the data to remote storage in Clouds.
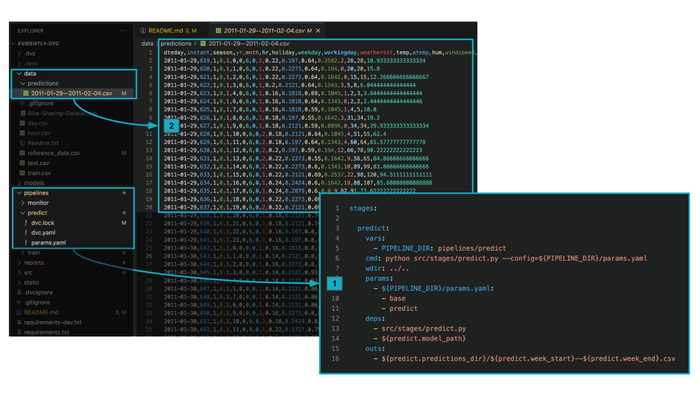
💡 Note: You may find more features in scenarios for Data Management with DVC in docs.
3. Run monitor pipeline
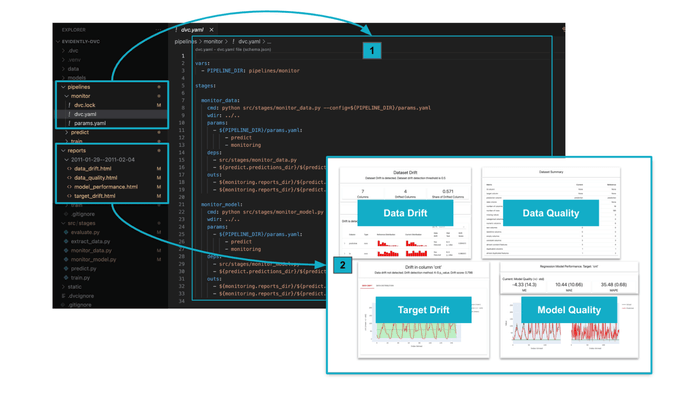
The monitor pipeline consists of two key stages: monitor_data and
monitor_model. These stages are crucial for ensuring your machine learning
models' ongoing health and performance.
$ dvc repro pipelines/monitor/dvc.yamlHere’s what happens in each stage:
- monitor_data:
- This stage is responsible for monitoring data quality and detecting any data drifts.
- Executes
src/stages/monitor_data.pywith configuration parameters frompipelines/monitor/params.yaml. - Produces HTML reports for data drift and data quality, and stores them in a
directory named as
reports/{predict.week_start}--${predict.week_end}.
- monitor_model:
- Focuses on monitoring the performance of the model and detecting any target drifts
- Executes
src/stages/monitor_model.pywith configuration parameters frompipelines/monitor/params.yaml. - Generates HTML reports for model performance and target drift, saved in the
specified monitoring reports directory names as
reports/{predict.week_start}--${predict.week_end}.
📈 Data Validation and Model Monitoring with Evidently
Now, let’s explore how Evidently works internally as a part of an ML model monitoring architecture.
Metrics and Reports
The idea behind Evidently is very simple: it calculates a bunch of metrics and organizes them into nice reports. Reports are the most effective way to analyze and debug your models and data visually. You may save reports as HTML files, JSON snapshots, or export the metrics externally by parsing JSON or Python dictionary outputs. This allows you to apply Evidently for multiple validation and monitoring scenarios in real-time and batch-scoring ML applications:
- save monitoring reports in HTML files and use them to analyze and debug your models and data,
- get values for specific metrics, and log them to external databases (like PostgreSQL) and dashboarding tools (like Grafana),
- save monitoring reports (as snapshots) in JSON files over time and run an Evidently Monitoring Dashboard for continuous monitoring.
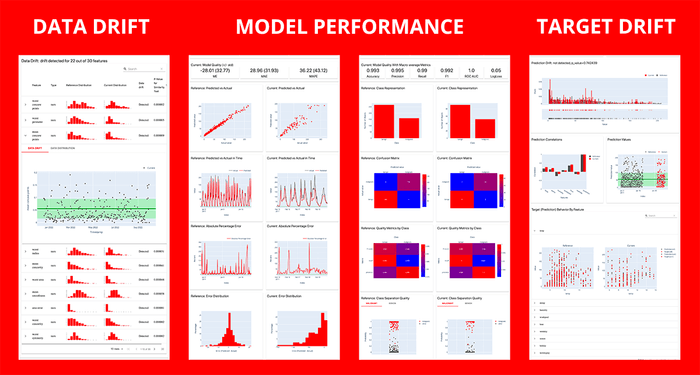
If you choose to use HTML and JSON files, you need a way to store and version them. In the following section of the tutorial, we will explore how DVC can assist with this.
Data Requirements
To calculate metrics monitoring reports with Evidently, you typically need two datasets:
- Reference dataset is a baseline for comparison or an exemplary dataset that helps generate test conditions. This can be training data or earlier production data. (from docs)
- Current dataset is the dataset you want to evaluate. It can include the most recent production data. (from docs)
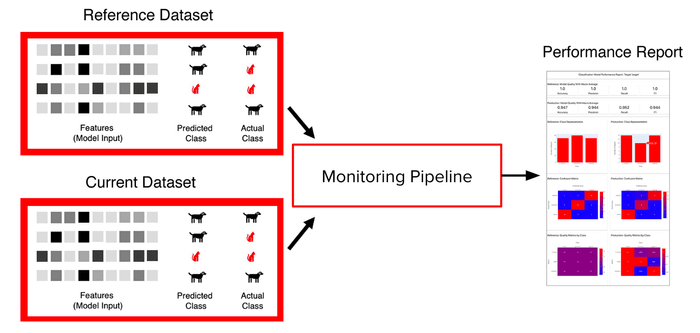
In this tutorial, the reference dataset is a sample extracted from the training dataset. It helps to automatically generate a reference during the training and align the version of the reference dataset and a model.
# src/stages/evaluate.py

reference_data = train_data.sample(frac=0.3)
📈 Automate Data and Monitoring Pipelines with DVC
This section will guide you through the design and implementation of monitoring pipelines, providing insights for the next improvements and customization.
Separate DVC pipelines
In the tutorial example, we tried to achieve the following ML system design principles:
- Modular Design: Each stage of the ML workflow, such as data preparation, model training, and monitoring, is encapsulated in separate DVC pipelines. This modular approach enhances maintainability and scalability.
- Pipeline Independence: These pipelines can be run independently, which allows for flexibility in execution and troubleshooting. In a typical scenario, training, inference, and monitoring pipelines run independently at different time intervals and environments.
- Reusability: By separating the pipelines, you can easily reuse components across different projects or stages of the same project.
As a result, the tutorial example has three pipelines for training, prediction
inference, and monitoring. DVC allows you to have multiple dvc.yaml files to
configure and run pipelines.
Let’s explore an excerpt from the pipelines/monitor/dvc.yaml to discuss a few
“advanced” configuration features you may find useful:
vars:
  - PIPELINE_DIR: pipelines/monitor

stages:
  monitor_data:
    cmd: python src/stages/monitor_data.py --config=${PIPELINE_DIR}/params.yaml
    wdir: ../..
    params:
      - ${PIPELINE_DIR}/params.yaml:
          - predict
          - monitoring
    deps:
      - src/stages/monitor_data.py
      - ${predict.predictions_dir}/${predict.week_start}--${predict.week_end}.csv
    outs:
      - ${monitoring.reports_dir}/${predict.week_start}--${predict.week_end}/${monitoring.data_drift_path}
- ${monitoring.reports_dir}/${predict.week_start}--${predict.week_end}/${monitoring.data_quality_path}- ☝️ Using
vars:- Variables (
vars) in DVC define values that can be reused across thedvc.yamlfile. It makes complexdvc.yamlfiles more readable and easier to update. - In this example,
PIPELINE_DIRis used to specify the pipeline directory in the project repository. You may reference this variable using the templating format to insert values like${PIPELINE_DIR}.
- Variables (
- ☝️ Using
wdir:- The
wdir(working directory) key indvc.yamlsets the directory context for running the commands defined in a stage. Allows you to use relative paths for dependencies (deps), outputs (outs), and scripts within that directory. - In this example,
wdir: ../..points to the repository root. So, paths indepsandoutsare easier to read and maintain.
- The
- ☝️ Using separate
params.yaml:- The
params.yamlfile holds parameters, and DVC allows it to have multiple ones. - This example has separate
params.yamlfile for each pipeline. To let DVC understand which file to use, we specify the full path to theparams.yamlusing thePIPELINE_DIRvariable.
- The
Storing monitoring configuration in params.yaml
In some monitoring scenarios, you may have parameterized pipelines. Using DVC
you may find it useful to reuse params.yaml file to configure the monitoring
pipeline. This brings a few benefits:
- Ease of Modification: You can quickly adjust the pipeline's behavior by modifying the parameters in this file, such as changing the data source or tuning model parameters.
- Version Control for Parameters: Since
params.yamlis under Git version control, changes in configurations are tracked by Git, ensuring reproducibility and transparency in your pipeline's evolution.
Let’s explore pipelines/monitor/params.yaml
---
data:
  predict_data: data/test.csv
  target_col: cnt
  prediction_col: prediction
  numerical_features: ['temp', 'atemp', 'hum', 'windspeed', 'hr', 'weekday']
  categorical_features: ['season', 'holiday', 'workingday']

predict:
  model_path: models/model.joblib
  week_start: '2011-01-29'
  week_end: '2011-02-04'
  predictions_dir: data/predictions

monitoring:
  reports_dir: reports
  reference_data: data/reference_data.csv

  # for monitor_model
  model_performance_path: model_performance.html
  target_drift_path: target_drift.html

  # for monitor_data
  data_drift_path: data_drift.html
data_quality_path: data_quality.html- ☝️ List features to be included in monitoring reports:
target_colandprediction_coldefine the names of the target and prediction columns,numerical_featuresandcategorical_featuresdefine feature names for monitoring purposes. This could be especially beneficial for data monitoring and data drift reports.
- ☝️ Parametrized data samples:
week_startandweek_enddefine the time frame for which predictions are generated. This example can be modified to support other approaches for data extraction.
- ☝️ Specify a reference dataset:
reference_dataspecifies a path to the reference dataset used in monitoring.- You may have multiple reference datasets and select among them to generate reports.
- ☝️ Specify the location to store monitoring artifacts:
monitoringsection also specifies the location for monitoring reports.- You may update the reports directory or filenames in a single place. It’s handy!
Log monitoring metrics with DVCLive and visualize them in VS Code IDE
DVCLive provides a Python API to log metrics, plots, models, and other artifacts from code. Metrics and plots saved with DVCLive can be automatically visualized in DVC extension for VS Code.
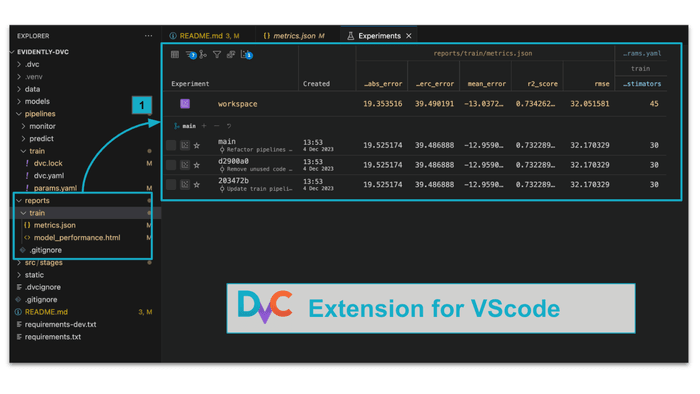
Let’s explore an example of the src/stages/evaluate.py script to demonstrate
how DVCLive can help in DVC projects.
from dvclive import Live
 ...
# Build a report
model_performance_report = Report(metrics=[RegressionPreset()])
model_performance_report.run(...)

# Extract metrics
regression_metrics: Dict = model_performance_report.as_dict()['metrics'][0]['result']["current"]
metric_names = ['r2_score', 'rmse', 'mean_error', 'mean_abs_error', 'mean_abs_perc_error']
selected_metrics = {k: regression_metrics.get(k) for k in metric_names}

# Save evaluation metrics with DVCLive
with Live(dir=str(REPORTS_DIR),
    dvcyaml=f"{pdir}/dvc.yaml",) as live:

    [live.log_metric(k, v, plot=False) for k,v in selected_metrics.items()]
This code snippet demonstrates how to log machine learning model performance metrics calculated with Evidently using DVCLive. Here's a breakdown of what it does:
model_performance_reportis created using Regression Preset from Evidently.- The
model_performance_reportis executed with.run(...), where the actual model evaluation and metric computation occur. - After
model_performance_reportbuilding completes, you may parse the required metrics. In this exampleselected_metricscontains['r2_score', 'rmse', 'mean_error', 'mean_abs_error', 'mean_abs_perc_error']. - Live object context logs
selected_metricsusinglive.log_metrics()method. There are few important arguments:dir=str(REPORTS_DIR)instructs DVCLive to save metrics toreports/traindirectorydvcyaml=f"{pdir}/dvc.yamlinstructs DVCLive to usedvc.yamlfor thetrainstage to add information about metrics files. The full path ispipelines/train/dvc.yaml.
💡 Note: If you are interested in other scenarios of DVCLive with Evidently integration, check this integration example
Versioning the Reference Dataset and Monitoring Reports
This example shows that DVC allows easily managed reference datasets for monitoring purposes, and version monitoring reports themselves.
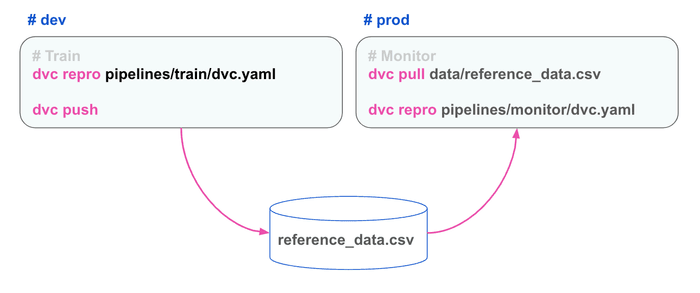
There are a few benefits for versioning reference datasets and monitoring reports with DVC:
- Registry of Reference Datasets: DVC helps store, version, and download datasets for monitoring purposes. You may need to download the reference dataset saved to cloud storage for a monitoring job in the production environment. DVC makes life easier!
- Traceability: This practice ensures traceability, allowing you to link model performance back to specific data versions.
- Version Control of Reports: You may want to manage all monitoring reports with DVC. It ensures a historical record of your model's performance and data quality.
🎨 Summing up
The combination of DVC and Evidently in automating data and monitoring pipelines offers a structured and efficient approach to ML model management. This setup enhances the reproducibility and reliability of your ML workflows and provides a clear framework for monitoring and improving your models over time. With this setup, you're well-equipped to maintain high-quality ML models responsive to the dynamic nature of real-world data.
However, this tutorial covers only a single approach for DVC and Evidently integration. We still working on other interesting scenarios and looking for community support! Stay tuned!
💡 Did you find this tutorial interesting? Please, leave your comments and share your experience with DVC and Evidently! Join us on Discord 🙌

