Adding Data to Build a More Generic Model
When you have an existing model trained for one problem, you might want to extend it to handle other problems. When you have data versioning, it's easier to see which data additions make your model better or worse and then you can see where to make improvements.


Adding more data to your dataset for a more generic model
Intro
You might be in the middle of training a model and then the business problem shifts. Now you have this model that has been going through the training process with a specific dataset and you need to make the model more generic.
There's likely something that your model learned that can be useful on this new dataset, so you might not have to restart the entire training process. We'll do an example of updating a pre-trained model to use a broader dataset with DVC. By the end of this, you should see how you can handle this quickly and start running new experiments to get a more generic model.
The original pre-trained model
For this post, we'll be making a more generic image classifier by taking the original dataset with bees and ants and adding cats and dogs to it. You can clone this GitHub repo to get the current bees and ants model and check out this post on how we experimented with both AlexNet and SqueezeNet to build this model.
So we're starting from our current bees and ants model and extending it to classify dogs and cats as well. We'll start by adding some cats and dogs data to our validation data and do some experiments with the current model to see how it performs on generic data.
Then we'll add the cats and dogs data to the training data and watch how the model improves as we run experiments.
Updating the dataset with DVC
To add the new cats and dogs dataset to the project, we'll use this DVC command.
$ dvc get https://github.com/iterative/dataset-registry blog/cats-dogsThis downloads a sample dataset with images of cats and dogs. You can use this command to download files or directories that are tracked by DVC or Git. This command can be used from anywhere in the file system, as long as DVC is installed.
This will make a new directory called ./cats-dogs/data/ that was downloaded
from the DVC remote and it has images for cats and dogs. Now we can slowly add
in the new data to the existing data.
We'll start by moving the val data for cats and dogs from the
/cats-dogs/data/ directory to the corresponding directory in
data/hymenoptera_data.
Just a quick note, cats and dogs don't really belong in the hymenoptera
directory since that's specific to ants and bees, but it's the easiest and
fastest way to add the data for this tutorial.
With this new data in place, we can start training our model.
Running new experiments with generic data
With the updated data, let's run an experiment on the model and see how good the results are. To run a new experiment, open your terminal and make sure you have a virtual environment enabled. Then run this command:
$ dvc exp runOnce the training epochs are finished, run the following command.
$ dvc exp show --no-timestamp \
--include-metrics step,acc,val_acc,loss,val_loss \
--include-params lr,momentum
The --no-timestamp hides the timestamps from table. The --includes-metrics
option lets us choose which metrics we want to show in the table. The
--includes-params option does the same for hyperparameters. This gives us a
table that's easier to read quickly.
────────────────────────────────────────────────────────────────────────────────────────────
Experiment step acc val_acc loss val_loss lr momentum
────────────────────────────────────────────────────────────────────────────────────────────
workspace 3 0.86885 0.46 0.31573 3.7067 0.001 0.09
data-change - - - - - 0.001 0.09
│ ╓ 3b3a2a2 [exp-23593] 3 0.86885 0.46 0.31573 3.7067 0.001 0.09
│ ╟ 93d015d 2 0.83197 0.41333 0.36851 3.4259 0.001 0.09
│ ╟ d474c42 1 0.79918 0.43333 0.46612 3.286 0.001 0.09
├─╨ 1582b4b 0 0.52869 0.39 0.94102 2.5967 0.001 0.09
────────────────────────────────────────────────────────────────────────────────────────────You'll notice that the validation accuracy is really low. That's because the training metrics are based on bees and ants while the validation metrics are based on bees, ants, cats, and dogs. If we looked at the validation metrics by class, they'd likely be better for bees and ants than cats and dogs.
That means we should probably add more data to the training dataset.
Adding the cats data to the training dataset
Let's add the train data for cats to the corresponding directory in
data/hymenoptera_data and go through another experiment run with a different
learning rate. With this new data, we can run another experiment. One important
thing to note here is that we're using checkpoints in our experiments. That's
how we get the metrics for each training epoch.
If we want to run a fresh experiment that doesn't resume training from the last epoch, we need to reset our experiment. That's what we're going to do with this command.
$ dvc exp run --resetThis will reset all of the existing checkpoints and excute the training script. Once it's finished, let's take a look at the metrics table with this command. It's the same as the one we ran last time.
$ dvc exp show --no-timestamp \
    --include-metrics step,acc,val_acc,loss,val_loss \
    --include-params lr,momentum
Now you'll have a table that shows both experiments and you can see how much
better the new one did with the cats data added.
────────────────────────────────────────────────────────────────────────────────────────────
Experiment step acc val_acc loss val_loss lr momentum
────────────────────────────────────────────────────────────────────────────────────────────
workspace 3 0.91389 0.87 0.20506 0.66306 0.001 0.09
data-change - - - - - 0.001 0.09
│ ╓ 9405575 [exp-54e8a] 3 0.91389 0.87 0.20506 0.66306 0.001 0.09
│ ╟ 856d80f 2 0.90215 0.87333 0.27204 0.61631 0.001 0.09
│ ╟ 23dc98f 1 0.87671 0.86 0.35964 0.61713 0.001 0.09
├─╨ 99a3c34 0 0.71429 0.82 0.67674 0.62798 0.001 0.09
│ ╓ 3b3a2a2 [exp-23593] 3 0.86885 0.46 0.31573 3.7067 0.001 0.09
│ ╟ 93d015d 2 0.83197 0.41333 0.36851 3.4259 0.001 0.09
│ ╟ d474c42 1 0.79918 0.43333 0.46612 3.286 0.001 0.09
├─╨ 1582b4b 0 0.52869 0.39 0.94102 2.5967 0.001 0.09
────────────────────────────────────────────────────────────────────────────────────────────There's another way you can look at the difference between the model before we
added the cats data and after. If you run this in your terminal, you'll get a
plot comparing the two experiments.
$ dvc plots diff exp-23593 exp-54e8aThe exp-23593 and exp-54e8a values are the ids for the experiments you want
to compare. You'll see a new file gets generated in the dvc_plots directory in
your project. That's where you'll find the index.html file you should open in
your browser. You'll see something similar to this.
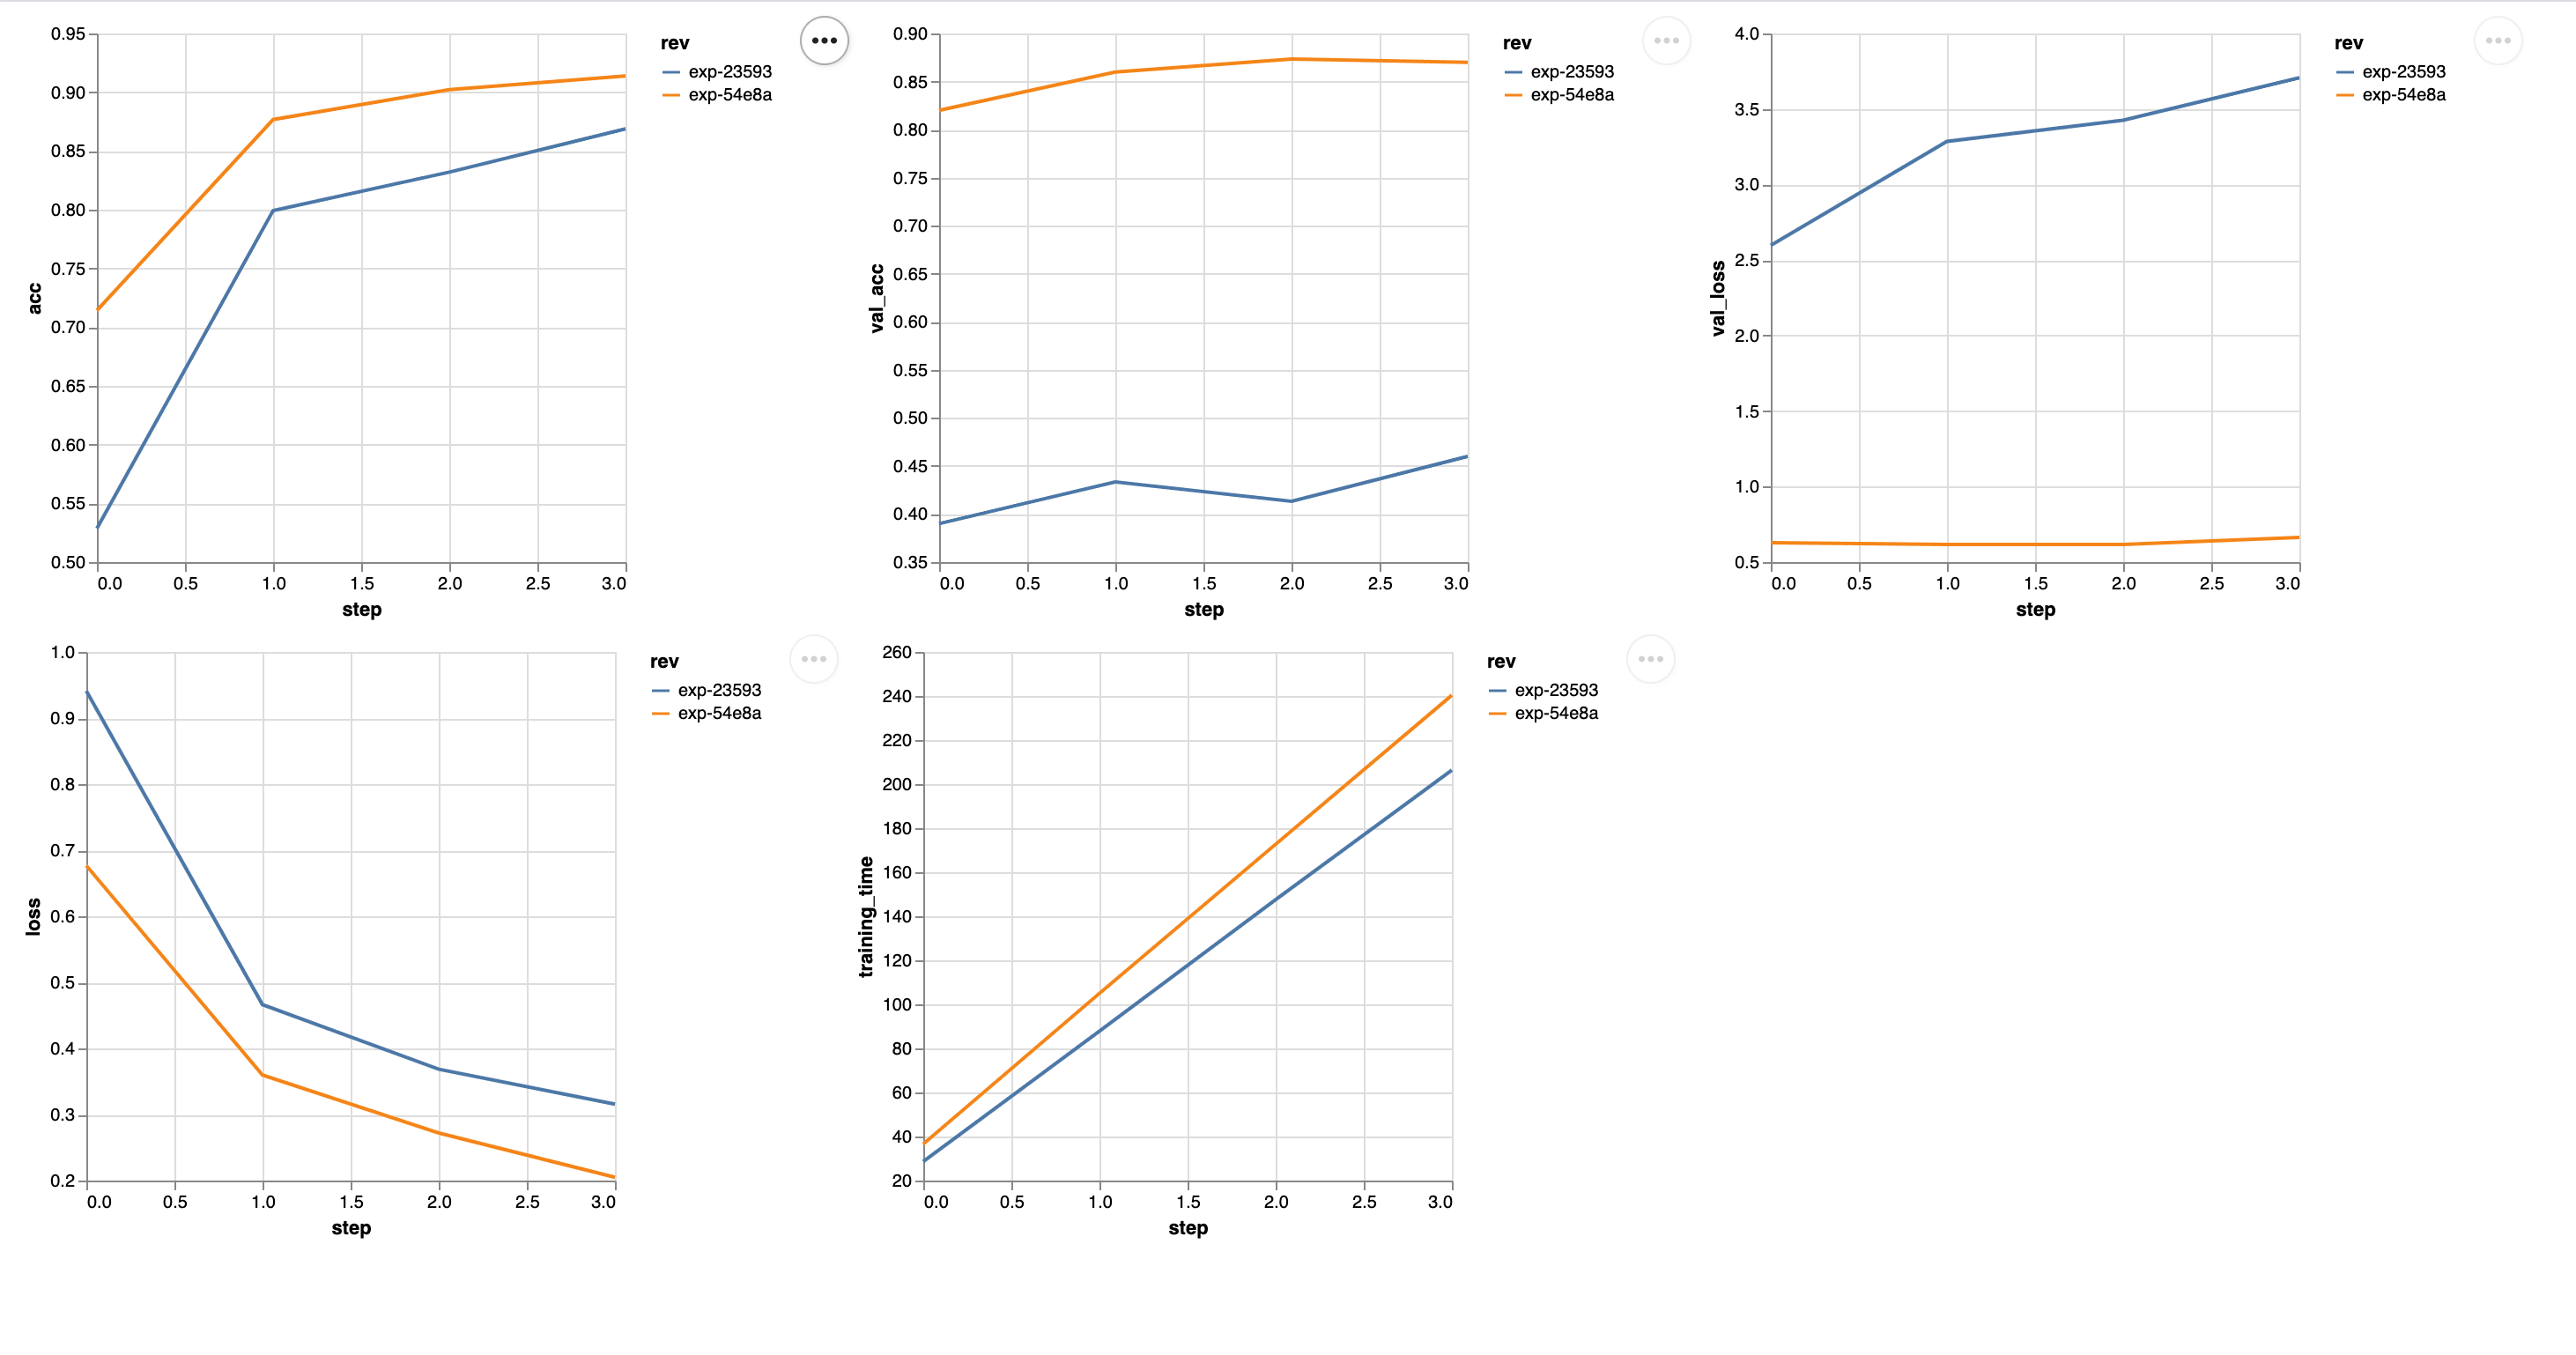
There's a huge difference in the accuracy of our model after we've added this
additional data. Let's see if we can make it even better by adding the dogs
data.
Adding the dogs data to the training dataset
We'll add the train data for dogs to the corresponding directory in
data/hymenoptera_data just like we did for the cats data. Now we can run a
new experiment with all of the new data included. We'll still need to reset the
experiment like before, so run the following command.
$ dvc exp run --resetOnce the training epochs are finished, we can take one more look at that metrics table.
$ dvc exp show --no-timestamp \
--include-metrics step,acc,val_acc,loss,val_loss \
--include-params lr,momentum
Now we'll have all three experiments to compare.
────────────────────────────────────�────────────────────────────────────────────────────────
Experiment step acc val_acc loss val_loss lr momentum
────────────────────────────────────────────────────────────────────────────────────────────
workspace 3 0.8795 0.90667 0.29302 0.25752 0.001 0.09
data-change - - - - - 0.001 0.09
│ ╓ c20220f [exp-82f70] 3 0.8795 0.90667 0.29302 0.25752 0.001 0.09
│ ╟ fcb5a0b 2 0.85915 0.92333 0.38274 0.25257 0.001 0.09
│ ╟ 3768821 1 0.80751 0.84667 0.47681 0.40228 0.001 0.09
├─╨ 7e1b8fb 0 0.64632 0.84 0.87301 0.46744 0.001 0.09
│ ╓ 9405575 [exp-54e8a] 3 0.91389 0.87 0.20506 0.66306 0.001 0.09
│ ╟ 856d80f 2 0.90215 0.87333 0.27204 0.61631 0.001 0.09
│ ╟ 23dc98f 1 0.87671 0.86 0.35964 0.61713 0.001 0.09
├─╨ 99a3c34 0 0.71429 0.82 0.67674 0.62798 0.001 0.09
│ ╓ 3b3a2a2 [exp-23593] 3 0.86885 0.46 0.31573 3.7067 0.001 0.09
│ ╟ 93d015d 2 0.83197 0.41333 0.36851 3.4259 0.001 0.09
│ ╟ d474c42 1 0.79918 0.43333 0.46612 3.286 0.001 0.09
├─╨ 1582b4b 0 0.52869 0.39 0.94102 2.5967 0.001 0.09
────────────────────────────────────────────────────────────────────────────────────────────These results make sense for the experiments we've run. We're paying attention to the validation accuracy here because this gives us a fair comparison of what's happening as we add more data.
The first experiment's training metrics are for bees and ants. The second experiment's training metrics are for bees, ants, and cats. And the third experiment's training metrics are for all four classes. So we can't really compare these metrics.
We can look at a comparison between the experiments with the cats data and
both the cats and dogs data.
$ dvc plots diff exp-23593 exp-54e8a exp-82f70
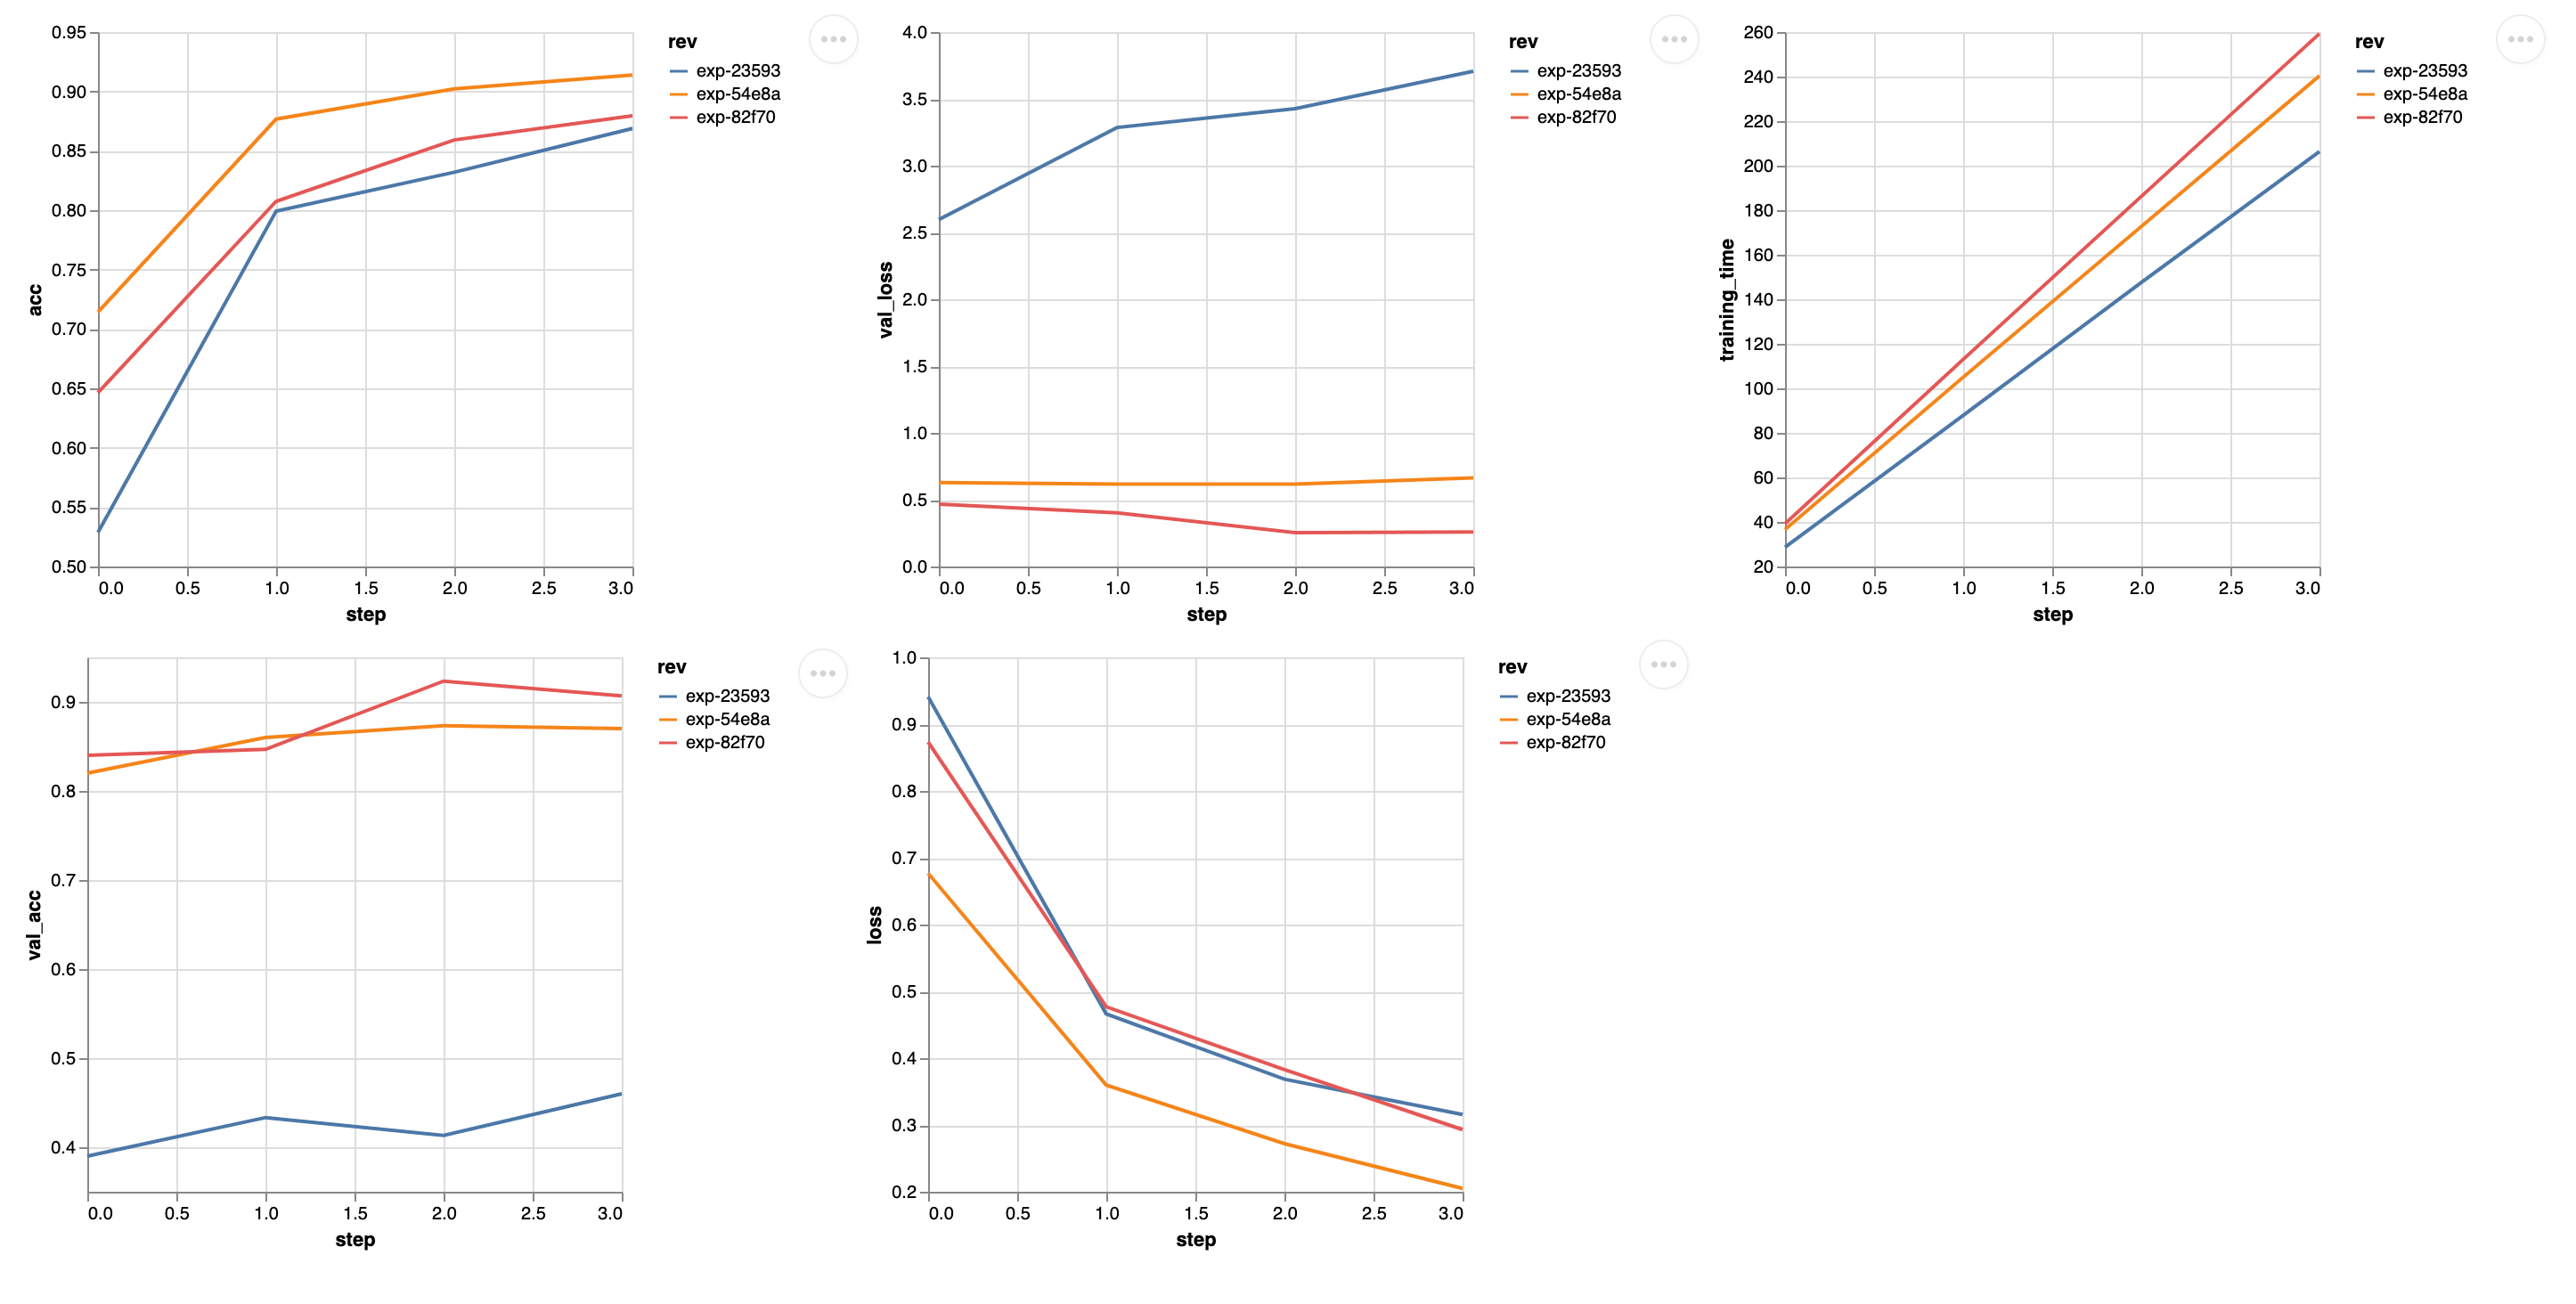
The results you see line up with what is expected for the validation metrics based on how we added the data to the training set. Now you can keep running experiments until you get your model tuned like you need it!
Conclusion
When you want to change datasets quickly and start tracking how they affect our model, using a DVC remote makes it easy to do so on different computers. You'll be able to quickly upload and download GBs of data and see how changes affect individual experiments.
If you need help with anything DVC or CML, make sure to join our Discord community! We're always answering questions and having good conversations with everybody that shows up.